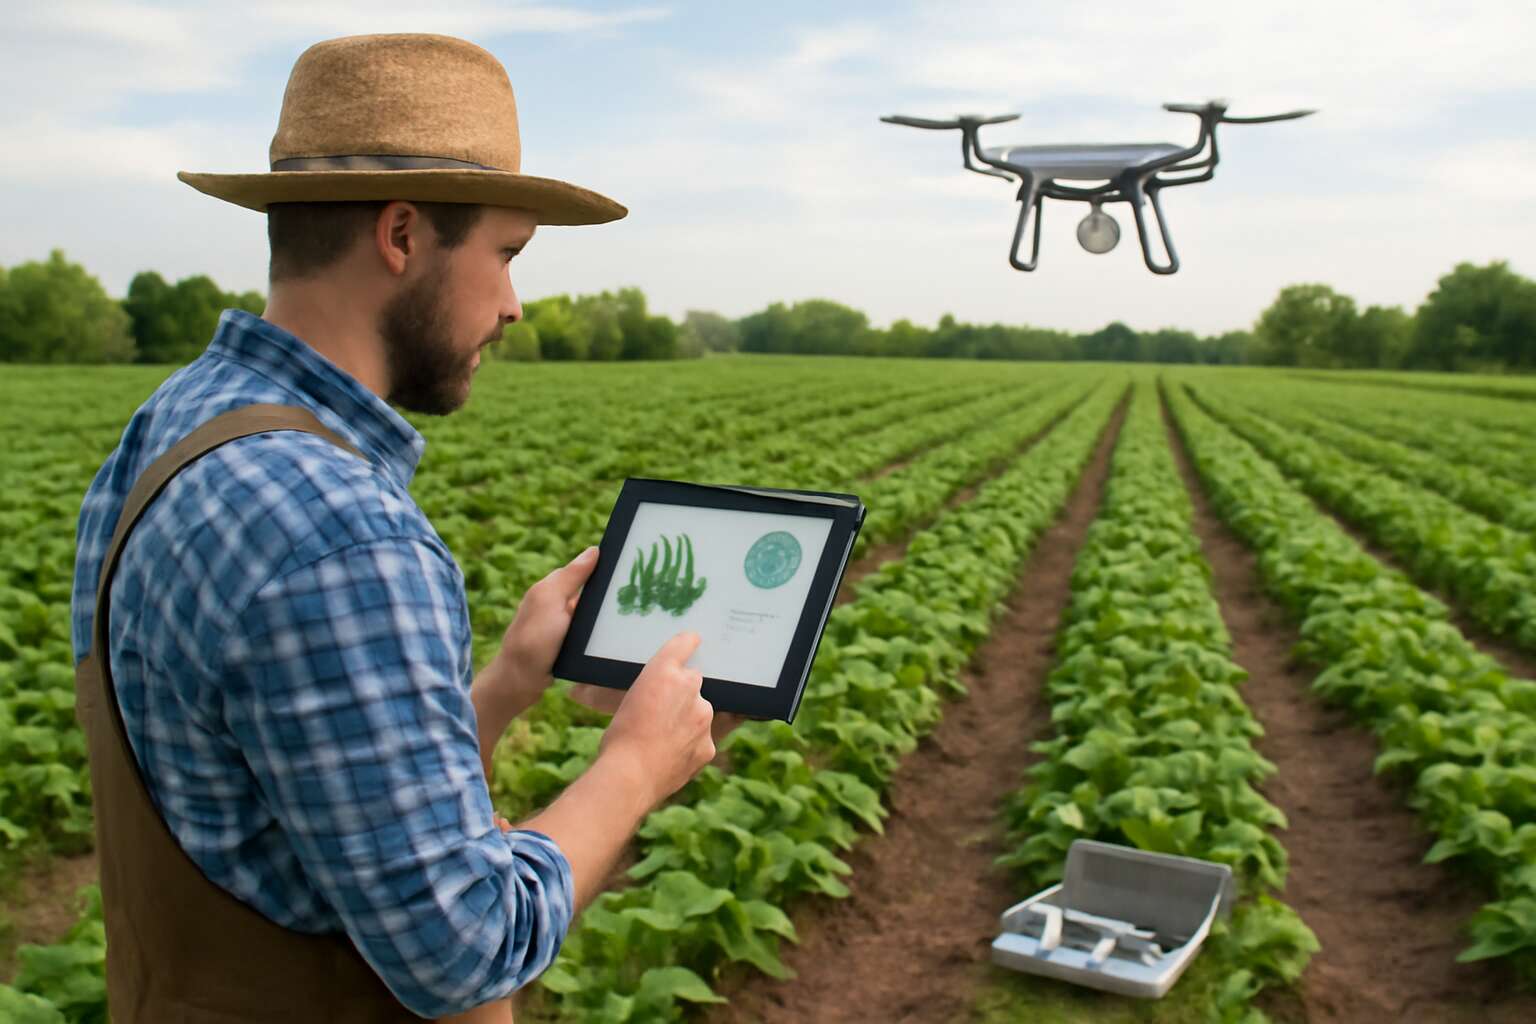
Understanding data in organic farming
Key data sources in organic farming
Across South Africa’s organic plots, data isn’t clutter—it’s cultivation. A recent industry note hints that data-guided decisions trim input costs by up to 15%, turning every drip into a deliberate choice!
Understanding data in organic farming means mapping currents: weather, soil life, pest signals, and market mood. This is where organic farming analysis of data begins, and I see patterns emerge from routine measurements and patient observation.
Key data sources in organic farming span on-farm records, soil tests, weather and climate data, and market signals.
- On-farm records of inputs, yields, and timing
- Soil tests, compost quality, and microbial activity
- Weather data, rainfall patterns, and drought indicators
- Market signals and consumer demand data
When read with care, this data paints a living map of soil health, biodiversity, and resilience—an ethos as old as farming, refreshed for a data-rich era.
Typical metrics for soil health and yields
Across South Africa, data-guided decisions trim input costs by up to 15%, turning planning into a deliberate art. Understanding data in organic farming means listening to the field—soil whispers, weather rhythms, and crop pulses—where every measurement curates resilience. This organic farming analysis of data invites patterns to emerge, revealing how soil life breathes and how a season’s moisture translates into yield contours.
From the soil surface to the far horizon, numbers become nuance rather than noise. Metrics drift as a living map—soil organic matter, biodiversity, infiltration, and nutrient balance—guiding crop rotations, compost choices, and cover-crop timing in a way that honours the land.
Typical metrics for soil health and yields include:
- Soil organic matter percentage
- Biodiversity indicators like earthworm abundance and beneficial microbial habitats
- Infiltration rate and moisture-holding capacity
- Nutrient balance and residue cover
- Yield stability and grain quality across seasons
This tapestry of numbers becomes a compass for practice.
Data quality and provenance in organic systems
Across South Africa’s diverse soils, data provenance is the weather vane you actually trust. The field whispers in moisture and microclimate, and I translate those whispers into decisions—with a wink and a ledger that lasts. “The field never lies,” a veteran agronomist likes to joke.
Understanding data quality hinges on provenance: where it came from, how it was collected, and how consistently it’s recorded. In the organic farming analysis of data, trust rests on clean inputs and clear metadata that travels from the furrow to the spreadsheet.
Key pillars of quality include:
- Data accuracy and error handling
- Source traceability from field to notebook
- Descriptive metadata and standardized units
- Audit trails and versioning
When provenance is respected, numbers become a narrative rather than noise, guiding decisions while remaining faithful to the land. This is the promise of data-driven farming here, a quiet art that blends discipline with wit and humility.
Ethical and regulatory data considerations
A field’s whisper travels in moisture and microclimate, but the real magic begins when we translate that data into decisions. In a recent sweep of organic trials, 27% of outcomes shifted when provenance metadata was incomplete. The field never lies, a veteran agronomist says, and careful data becomes a trustworthy compass through the rows.
Understanding data in organic farming hinges on ethical and regulatory considerations that guard trust and soil health.
- Data ownership and farmer consent for on-farm measurements
- Adherence to organic standards and proper regulatory reporting
- Clear metadata, standardized units, and transparent audit trails
Viewed through that lens, “organic farming analysis of data” becomes a narrative rather than noise, guiding decisions while honoring the land. In South Africa’s diverse soils, this approach helps numbers sing without shouting.
Data collection methods for organic farming
Field trials and on-farm experiments
Across South Africa’s varied farms, field trials show data-guided decisions cut input waste by up to 25%. The magic lies in how teams measure and interpret outcomes, turning soil, seed, and sun into a clear map toward healthier crops!
Data collection methods for organic farming rely on robust design: randomized blocks, replicated plots, and proper controls. Field trials and on-farm experiments track soil health, moisture, pest pressure, and weed dynamics across seasons. This is the core of organic farming analysis of data.
- GPS-tagged plot mapping
- Soil moisture and organic matter probes
- Regular scouting of pests and beneficial insects
- Harvest records and phenology notes
With such data, studies travel from experimental beds to home fields, guiding choices that respect organic integrity and South Africa’s diverse agroecologies.
Sensor data from soil and climate tools
Across South Africa’s varied farms, field trials show data-guided decisions cut input waste by up to 25%. A network of sensors trims water use and protects soil life. Sensor data from soil and climate tools turns raw numbers into practical choices, a clear pathway in organic farming analysis of data. When soil moisture falls and temperatures swing, decisions become maps rather than guesses.
- Soil moisture and temperature probes
- Soil organic matter and EC sensors
- Microclimate stations tracking rainfall, humidity, wind
- Pest-pressure indicators from trap counts
These data streams travel from experimental beds to home fields, guiding choices that respect organic integrity and South Africa’s diverse agroecologies. It’s the living map of organic farming analysis of data.
Farm records and certification documentation
Across South Africa’s patchwork farms, record-keeping has shifted from a clerical nuisance to a strategic asset. This is the living backbone of organic farming analysis of data, turning routine logs into actionable insight.
Data collection methods hinge on disciplined farm records and rigorous certification documentation. Each entry—whether an input receipt, a harvest date, or a compliance note—ends up shaping trust with inspectors and customers alike, performed with the air of someone calmly untangling a shoelace during a ceremony.
- Farm records and logbooks: inputs, applications, harvests
- Certification documentation: organic certificates, audits, supplier declarations
- Traceability data: batch numbers, lot histories, transport records
This flow keeps organic integrity visible from field to certificate, a quiet, stubborn commitment to transparency in South Africa’s diverse agroecologies.
Remote sensing and satellite imagery for organic fields
Across South Africa’s patchwork farms, satellite eyes turn overhead into actionable insight. “Data is the new compost for decision-making,” a seasoned agronomist likes to say, and remote sensing spreads that nourishment from sunlit veld to shaded orchards. This is organic farming analysis of data in motion, a shift from guesswork to evidence that travels from canopy to certificate with grace.
Key data collection elements include:
- Landsat and Sentinel-2 imagery for field-scale detail
- Vegetation and moisture indices such as NDVI and NDRE
- Time-series analytics to identify growth cycles and stress periods
Processing starts with atmospheric correction and calibration, then alignment with farm records. In SA’s cloud-prone regions, cloud masking and local calibration ensure robust signals, supporting a coherent field-to-certificate narrative.
Data collection challenges and solutions
Across South Africa’s patchwork farms, data whispers from the dark like dew on leaf veins. In SA, 32% of farm records are incomplete when decisions must be made. This is the organic farming analysis of data: turning whispers into verifiable signals that guide soil and canopy with measured patience!
Data collection methods sweep like night watchmen across the field:
- On-site diaries and farm logs
- Wireless soil and microclimate sensors
- Mobile apps for growers and workers
- Participatory data collection with field staff
In SA’s cloud-prone regions, signals can vanish behind cloud cover and inconsistent formats. The remedy is clear: cloud-enabled storage, standardized templates, local calibration, and focused training that makes data a living narrative rather than a collection of numbers.
Statistical analysis and modeling for organic farming data
Descriptive statistics for soil and crop indicators
Statistical analysis and modeling for organic farming data unlocks the hidden order in field chaos. In South Africa, where smallholders and experimental plots shape the landscape, modest shifts in rainfall and soil carbon tilt yields year to year. This is part of the organic farming analysis of data that translates noise into actionable insight, showing which practices reliably lift productivity while safeguarding soil life.
Descriptive statistics for soil and crop indicators offer a clear snapshot: means, medians, ranges, and variability for organic matter, pH, nutrient availability, and biomass. By profiling baseline conditions and seasonal changes, we can flag outliers and track progress without losing touch with the living ecosystem.
Predictive models for yield and disease risk
Across South Africa’s patchwork farms, weather swings sculpt harvests. In this landscape, organic farming analysis of data reveals patterns that turn chaos into doctrine—yield stability rises when seasonal signals are read with patience and care!
This section embraces statistical analysis and modeling for organic farming data. Predictive models for yield and disease risk map field-level narratives—time series, regression, and light-weight machine learning knit together climate variability, soil moisture, and plant health.
- Yield drivers like rainfall timing, soil carbon, and nutrient availability
- Disease risk indicators such as canopy humidity and leaf wetness
With robust validation and scenario testing, insights translate into field decision support. By simulating drought, pest pressure, and cover-crop effects, we illuminate reliable practices without sacrificing soil life—organic farming analysis of data is the compass guiding this work.
Experimental design and ANOVA in field trials
The plant doesn’t lie; the data tells the truth. Across South Africa’s patchwork fields, statistical analysis and modeling reveal how seasonal swings shape harvests. This section grounds itself in experimental design and ANOVA in field trials, where organic farming analysis of data becomes a compass through variability, turning chaos into evidence and insight into confidence.
By framing field trials with randomized blocks, replication, and careful controls, we begin to separate the signal of rainfall timing, soil carbon, and nutrient availability from the noise of microclimate and measurement error. ANOVA helps compare yields and disease indicators across treatments while honoring organic practices.
With robust interpretation, the models translate into field understanding—scenario thinking for drought, pest pressure, and cover-crop interactions—without sacrificing soil life. Organic farming analysis of data becomes a quiet conscience of decision-making, guiding researchers and farmers toward resilient, soil-first outcomes.
Data visualization and interpretation for organic farming
Visualizing temporal trends in soil health
Across South Africa’s diverse soils, yield swings can outpace a farmer’s intuition—unless you map the whispers of the land. A single season’s data pulse can reveal patterns that raw numbers miss, turning uncertainty into a guiding light for organic practices. The punchline? listening to trends beats guesswork every harvest.
Visualizing temporal trends in soil health means translating time into color, curves, and stories. I watch moving averages smooth erratic swings, while anomaly signals highlight weeks when organic matter or moisture drift from the norm. Consider these visualization touchpoints:
- Soil organic matter over time
- Moisture and drainage patterns
- Microbial activity proxies
From charts, we craft narratives that drive field decisions. This is central to organic farming analysis of data, turning disparate measurements into actionable insight and preserving soil vitality for seasons ahead.
Geospatial mapping of organic fields
Geospatial maps turn field whispers into a chorus you can read at a glance. “Maps are conversations with the soil,” a mentor once said, and in South Africa’s mosaic of soils, data visualization and interpretation reveal patterns no single sensor can whisper. This is the essence of organic farming analysis of data: turning place into insight, and insight into action.
Geospatial mapping of organic fields layers soil type, drainage, moisture pockets, and historical yields to expose microclimates and risk zones. By marrying satellite imagery with farm records, we reveal where organic matter flourishes and where drainage lags, guiding precise amendments and cover-crop choices.
- Field boundaries and parcel topology
- Soil properties and organic matter indices
- Moisture and drainage gradients
Interpreting these visuals requires a storyteller’s eye—triangulating maps with notes from the field and translating visuals into practical care for organic fields across SA’s varied landscapes.
Dashboards for farm managers
Dashboards turn the whispers of soil into a chorus farm managers can read at a glance. In South Africa’s mosaic soils, a well-tuned visualization blends rainfall rhythms, moisture pockets, and organic matter signals into a single, readable map. “Maps are conversations with the soil,” a mentor once said.
Data visualization and interpretation for organic farming dashboards empower farm managers to steer inputs with clarity rather than guesswork. This is the essence of organic farming analysis of data.
Think of the dashboard as a personal oracle: it highlights trends, flags anomalies, and links field notes to maps. To read it well, consider these core elements:
- Real-time soil moisture and drainage heatmaps
- Temporal trend dashboards for yields and organic matter
- Alerts for moisture deficits and nutrient imbalances
- Geospatial field boundaries and parcel topology summaries
Communicating uncertainty and confidence in results
Dashboards don’t promise perfect certainty, but they hum with clarity. In South Africa’s mosaic soils, moisture can swing by 30–40% between micro-sites, and a single rain event can rewrite a field’s story in minutes. This is the art of organic farming analysis of data—turning whispers into readable charts and maps, so farm managers read weather, water, and soil signals at a glance. Reading uncertainty as a feature, not a flaw, makes the narrative honest.
- Provenance that shows where each data point originated
- Calibration notes and sensor confidence for moisture and nutrients
- Prediction intervals and alert thresholds that communicate how far a trend may drift
That blend of clarity and caveat helps South African growers steer inputs with restraint and precision. It’s a conversation with the land—honest, a touch witty, and increasingly essential in the organic era!
Practical applications and case studies in organic farming data analysis
Case study: soil organic matter and crop yield relationships
In the pre-dawn of a South African field, a single soil metric can outtalk a weather forecast—and the organic farming analysis of data that follows turns chatter into strategy. The case study on soil organic matter and crop yield relationships shows how richer organic matter links with steadier yields under organic management, translating laboratory nuance into field-ready insights. It’s a reminder that numbers, handled with tact, can charm the ledger as deftly as a social aside!
Practical applications flow from this: calibrating soil health targets to yields and weaving soil tests with climate signals to forecast results without guesswork.
- Longitudinal soil organic matter monitoring reveals non-linear yield responses
- Moisture and temperature interactions sharpen predictions
- Guides cover crop choices, compost strategies, and certification planning
South African growers will recognize the wisdom: organic farming analysis of data, data-friendly trials, clear provenance, and transparent uncertainty levels make decisions less mystical and more manageable.
Case study: moisture management using sensor networks
A brisk dawn over a South African field reminds us that moisture speaks louder than forecasts, and a handful of sensors can translate that murmur into strategy. In this case study, moisture management using sensor networks shows how organic farming analysis of data turns lab nuance into field-ready understanding — and yes, the sensors finally mind the ledger.
Practical applications bloom from this insight:
- Real-time moisture mapping across field zones
- Transparent data provenance for trust with buyers and certifiers
- Visualizing non-linear yield responses as stories rather than forecasts
South African growers will recognize the value: data that respects uncertainty, communicates clearly, and keeps debates about inputs and yields civilized. The case study exemplifies organic farming analysis of data, turning whispers into deliberations that guide conversations around the ledger without shouting.
Case study: certification data and compliance monitoring
Across South Africa’s diverse fields, a simple ledger can quiet debate faster than a committee meeting. Real-world audits show a 28% drop in non-conformances when data provenance is treated as a co-farmer rather than a bureaucratic afterthought.
Practical applications bloom from this insight in certification and compliance.
- Real-time certification data mapping across field zones
- Tamper-evident audit trails from field to storefront
- Transparent narratives of organic handling for buyers and certifiers
Case study: certification data and compliance monitoring illustrates how on-farm records harmonize with external audits, easing supplier verification and reducing surprises at certification visits. This is where organic farming analysis of data reveals its value.
In practice, stakeholders enjoy smoother renewals, stronger buyer trust, and conversations around the ledger that sound like diplomacy, not polemic.
Best practices for ongoing data-driven decision making
A vigorous ledger can outpace debate and quiet uncertainty in a heartbeat. Across South Africa’s patchwork fields, the strongest argument is data lived in the field—an organic farming analysis of data that shapes decisions as surely as rain. These figures become partners, not papers.
Practical applications bloom from this alliance: field zones mapped in real time; transparent records that reassure auditors; and narratives that support trust with buyers. For ongoing data-driven decision making, establish consistent data collection, ensure traceability, and train teams to read trends as they emerge.
- Real-time mapping of field blocks to decision points
- Clear, accessible records that support audits without drama
- Seasonal reviews that compare plans with outcomes
In practice, this approach nudges performance upward with fewer surprises and more confident renewals. The harvest speaks through the ledger, and stakeholders listen, because the data tells a coherent, human story across South African farming landscapes.

0 Comments